
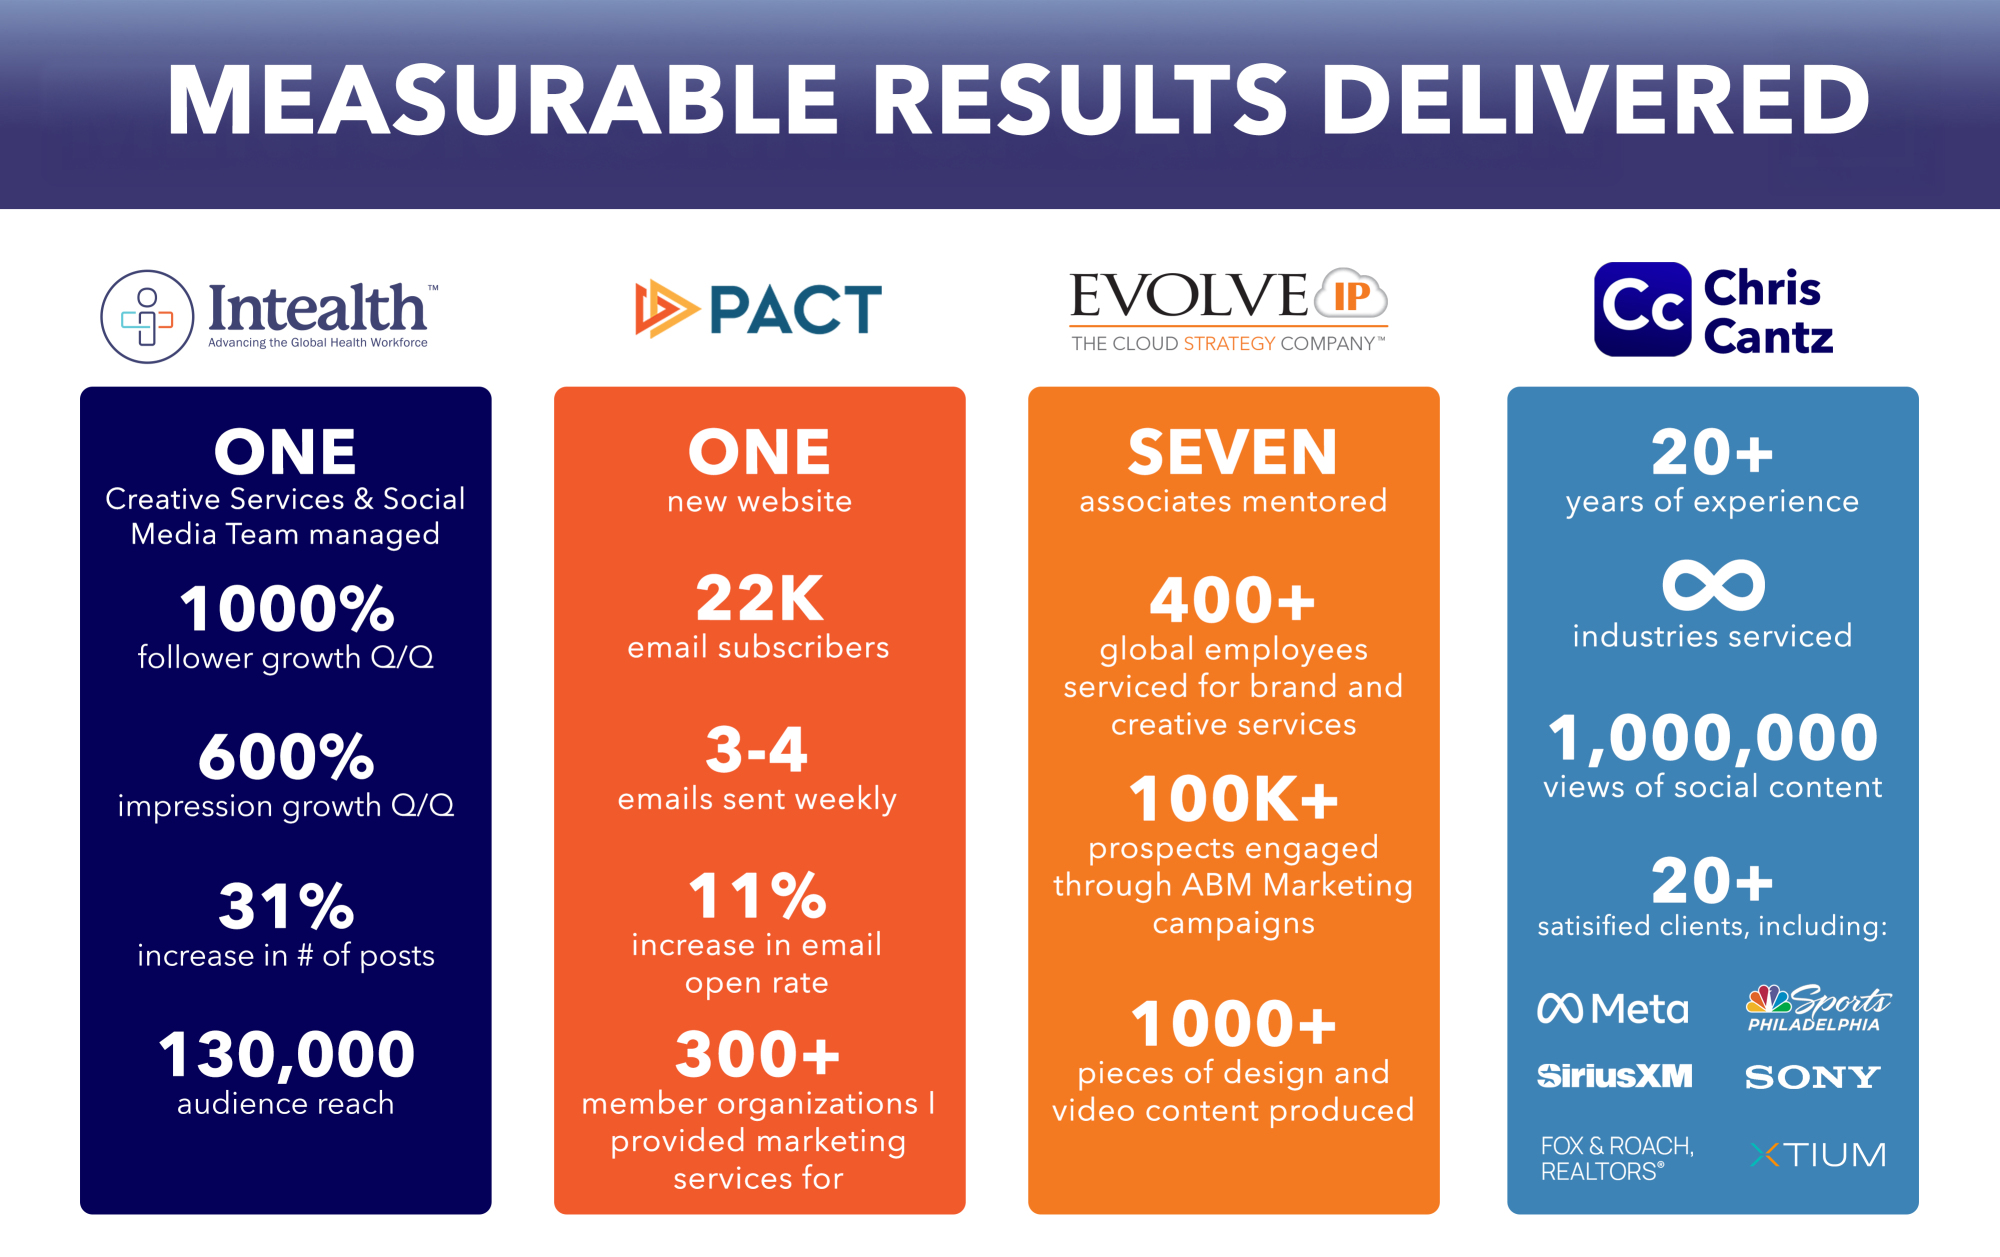
As they say, the proof is in the pudding. I have made a career out of providing measurable growth. The numbers don't lie.
THE CHALLENGE
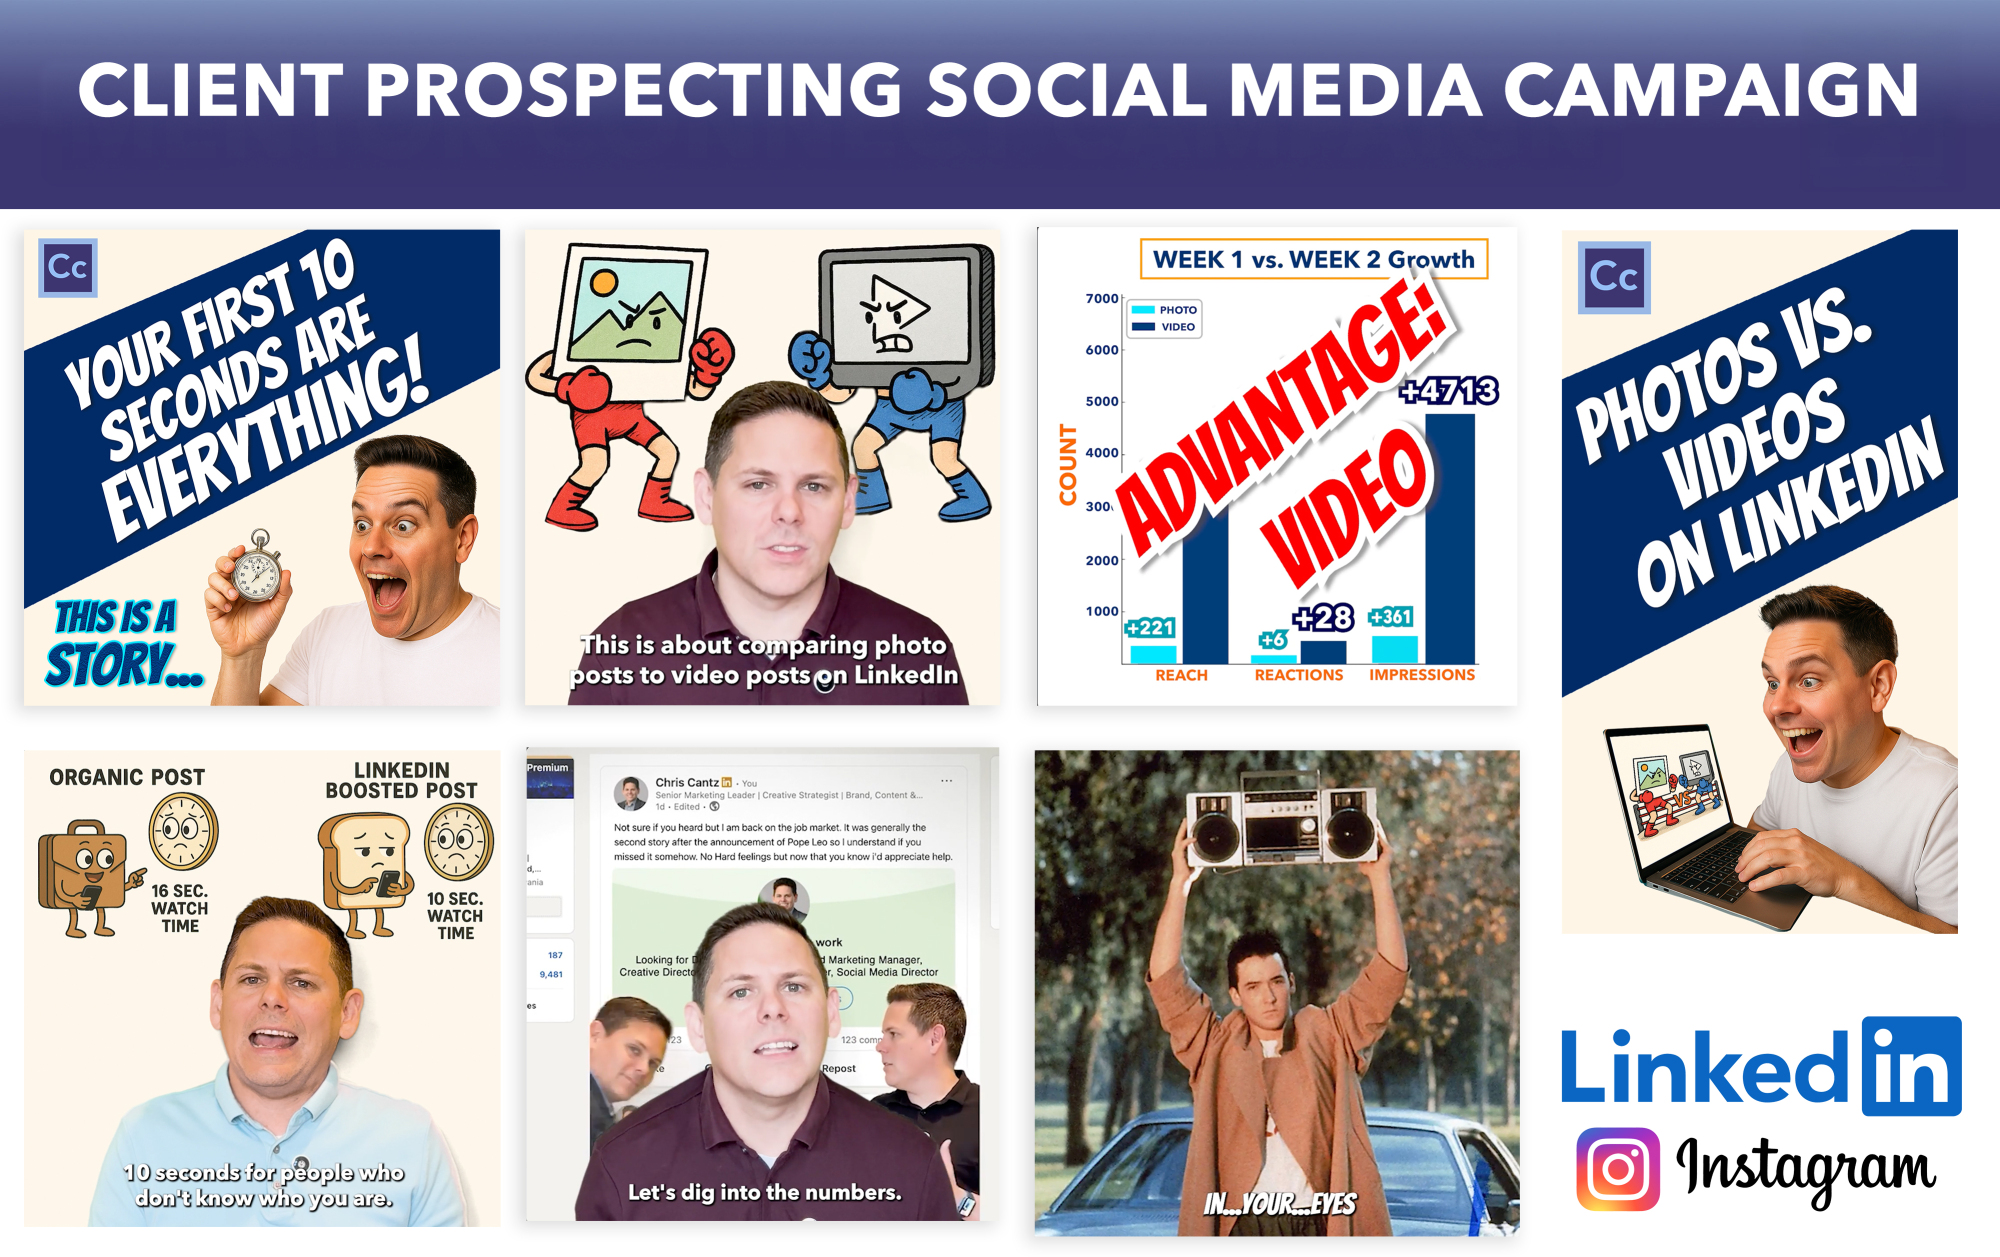
Upon hitting the job market, I wanted a way to announce to my network that I was a free agent. Rather than a simple text post, I created a multimedia series on LinkedIn for self-promotion. In addition to advertising for myself, I also wanted to develop a case study with measurable analytics: would photo or video posts have more reach on LinkedIn?THE RESULTS
So did posting photos or videos generate more attention on LinkedIn for a personal profile? (videos for the win) Was it worth a paid campaign to boost a video? (not in my case) How are Instagram Reels for gathering attention? (better than carousel posts). This was a good, short, interactive way to deliver results for myself, make people laugh occasionally.THE OUTCOME AND IMPACT
I received 5 job interviews and 2 freelance clients that I am still working with.My content generated 19,000 Impressions. 11,000 members reached. 7500 views. Boom shakka lakka.


